Welcome to msentert.com's Information technology division
Engine information system
Author Mahamad Suleman Nadaf
Copyrighted material, not to modify and reproduce the material
Introduction
Structured systems design and structured systems analysis of Engine information system software. This article contains structure chart, data flow diagrams of EIS. Processed information about engine measurement and performance these include physical measurement that is geometrical dimension of engine such as cylinder diameter, length of piston stroke, cylinder volume and engine ratings such as efficiency, horsepower, compression ratio, heat balance sheet. Structure chart of EIS for a function-oriented design the design can be represented graphically by structure charts. The structure of a program is made up of the modules of that program to gather interconnections between modules. Every computer program has a structure it’s structure can be determined by the structure chart of a program is a graphic representation of it’s structure. In a structure chart module is represented by module name written in the box. The functional module of a system (Either the problem domain or the solution domain) can be represented by a Data flow diagram (DFD). Data flow-based modeling is often referred to as the structured analysis technique that uses function-based decomposition while modeling to problem. It focuses on the function performed in the problem domain and the data consumed and produced by these functions. It is a top-down refinement approach which was originally called structured analysis specification and was proposed for producing the specification. System designing includes module designing which are described in structure chart and data flow diagrams. Designing input this is data entry section this is concerned to logic of the program what data has to be entered in the input fields example engine number, no of cylinders, cylinder bore diameter etc. these are input fields. Designing output this section gives the computed results reports are part of the designing output section. The outputs are calculated results set of gathered sorted information reports graphs etc. EIS gives reports of engine measurement and performance such as geometrical dimensions, horsepower, efficiency, compression ratio and heat balance sheet.
This technical paper is pertaining to the Engine information system software. Illustrates how programming logic is used to develop software and mathematical formulas used for computing engine performance. Structured system design and structured system analysis of EIS gives the description about structured systems design and structured systems analysis of the software modules used in the software program. Software is a set of computer programs. Computer programs give instructions to computers to perform specific tasks. EIS consists of a set of different programs that are going to compute engine performance and give the desired output. Software is going to design and develop based on actual system and requirements of desired output result. The outputs are calculated results set of gathered sorted information reports graphs etc. EIS gives reports of engine measurement and performance such as geometrical dimensions, horsepower, efficiency, compression ratio and heat balance sheet. The process of identifying, modeling and documenting how data moves around the information system is called data flow. Data flow modeling examines process activities that transform data from one to another data store (holding areas for data) external entities (what sends data into a system or receives data from a system) and data flows routes by which data can flow. Power unit of an Automobile is that component or part which produces power to drive the automobile. It is generally in the form of an internal combustion engine running on petrol or diesel. The nature and the type of the tests to be conducted depend upon various factors some of which are the degree of development of the particular design and accuracy required the funds available for the nature of the manufacturing company and its design strategy. The purpose of running an engine is to obtain mechanical power. The difference between indicated horsepower and brake horsepower output of an engine is the friction horsepower. Almost in variably the difference between good engine and bad engine is due to difference between their frictional losses. Compression ratio in an internal combustion engine degree to which the fuel mixture is compressed before igniting.
2. Structure chart
2.1. Modelling
Structure chart SC in software engineering is a chart which shows the breakdown of system to its lowest manageable levels. They are used in structured programming to arrange programming modules into tree. Each module is represented by a box which contains module name. The tree structure visualizes the relationships between modules. The structure chart is top down modular. Design tool constructed of squares representing the different modules in the system and lines that connect them. In structure analysis structure charts are used to specify the high-level design or architecture of a computer program. Computer program is usually a collection of instructions that can be executed by a computer to perform a specific task. Programmers use a structure chart to build a program in a manner similar to how an architect uses a blueprint to build a house. Represent hierarchical structure of modules. It breaks down the entire system into lowest functional modules to describe functions and sub-functions of each module of a system to a greater detail. Structure Chart partitions the system into black boxes (functionality of the system is known to the users but inner details are unknown). Inputs are given to the black boxes and appropriate outputs are generated. Modules at top level are called modules at low level. Components are read from top to bottom and left to right. When a module calls another, it views the called module as black box, passing required parameters and receiving results. Structure diagrams are all diagrams that model a static component of a system where data changes but not the structures of the elements and their relationships with each other. Data objects are either produced or consumed by the system. During the evaluation and solution synthesis the analyst creates modules of the systems in an effort to understand data and control flow functional processing and operational behavior. These models serve as foundation for software design as the basis of creations of software specifications area of effort is specification. Software requirement specification is document and is producing the functional behavior architectural interface and performance related requirement of the user.
2.2. Engine database file.
Where data is going to be stored after processing the engine’s information. Engine details are identified by unique identification like vehicle or engine make, model or engine number. In this technical paper engine details are identified by engine number.
2.3. Engine
An engine is a module which contains 3 modules see figure 1.
1. Add
2. Update
3. Delete

Figure 1 Structure chart of Engine information system.
2.3.1. Add module
This program module adds the records to database after processing engine’s information. “Add” is having many fields engine number cylinder bore diameter, length of the stroke etc. Data has to be entered in these fields after entering the required data into fields “Add” program computes engine performance send the output to database. Processed records are stored in database file.
2.3.2. Update module
This program module does same as “Add” if you want to make any changes to existing record you can change here based on the engine number primary field or key field. Whenever you want you can fetch the record and can make the changes once the engine number is added that cannot be changed. Based on this field related data can be changed in the update module.
2.3.3. Delete module
This module is used to delete records. Based on engine number fetch the record and delete the entire record including engine number.
2.3.4. Reports
This module produces reports of processed information of engine performance.
1. Single Engine
2. Geometrical dimensions
3. Horsepower
4. Efficiency
5. Compression ratio
6. Heat balance sheet
2.3.5. Single Engine
The report for each engine is going to be displayed on one page.
2.3.6. Geometrical dimensions
A report of geometrical dimensions based on engine number is going to be displayed for multiple engines.
-
Engine displacement
-
Swept volume
-
Cylinder volume
-
Clearance volume
-
Cross section of the piston
Copyrighted material, not to modify and reproduce the material
2.3.7. Horsepower
A report of the horsepower of the engine based on engine numbers is going to be displayed for multiple engines. Tax horsepower
-
Indicated horsepower
-
Brake horsepower
-
Friction horsepower
2.3.8. Efficiency
This module gives a report of efficiency based on engine numbers for multiple engines.
-
Mechanical efficiency
-
Brake thermal efficiency
-
Indicated thermal efficiency
-
Compression ratio
2.3.9. Compression ratio
This module gives the report of compression ratio. See table 7.
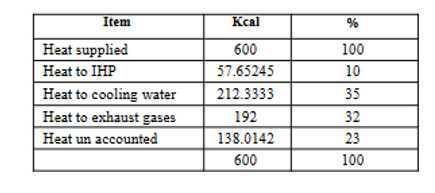
2.3.10. Heat balance Sheet
This module gives information about total heat utilized. The heat produced inside the engine cylinder is not fully utilized to do the external work. Some of the heat is carried away by the engine cooling system, exhaust gases and radiation. These heat losses reduce the thermal efficiency of the engine. Frictional losses are also there which consume about 10% of the total heat produced. About 20% of the heat produced is utilized for turning the wheels. During a specified period (usually a minute), the total heat produced inside the cylinder must be equal to the sum of the various heat losses that are utilized for useful work. All these items, when recorded in a tabular form, constitute what we call a heat balance sheet. See table 1.
3. Data flow diagram
Data flow diagram illustrates how data is processed by a system in terms of inputs and outputs. As it’s name indicates, it focuses on the flow of information where data comes, where data goes, where it stores. They are graphical representation of data flow through a system or sub system used to model information system are used to graphically represent the flow of data in an information system describes the process that is involved in a system to transfer data from the input to the file storage and reports generation
3.1 Software requirement analysis
It is the process of collecting, understanding, modeling and documenting the software requirements which are essential to
develop high quality software. Mostly the software engineer is responsible for the task of software requirement analysis but in case of complex system this task is performed by the specialist commonly referred to as system analyst. It is the job of system analyst to extract exact requirements from the particular area of automotive engineering and specify them in a manner in which these requirements can be translated into design.
3.2. DFD of Engine information system
Refer figure 2 from engine database file engine details which are pertaining to particular engine go to process boxes. Process boxes process the information processed information is going to store in engine database file and to report boxes to produce the reports. Whenever required add new record fetch the record from database file can make update or delete the record of particular engine.
3.2.1. Compute geometrical dimensions
Details of particular engine flows to process box “Compute engine geometrical dimensions” geometrical dimensions are got computed. Processed information is going to store in engine database file and to produce the report to “Produce reports” box. See table 3 and 4.
3.2.2. Compute horsepower
Details of particular engine flows to process box "Compute horsepower" engine horsepower is get computed as processed information is going to store in engine database file and to produce the report to “Produce reports” box. See table 5.
3.2.3. Compute efficiency
Details of particular engine flows to process box "Compute engine efficiency “efficiency is get computed as processed information is going to store in engine database file and to produce the report to “Produce reports” box. See table 6.
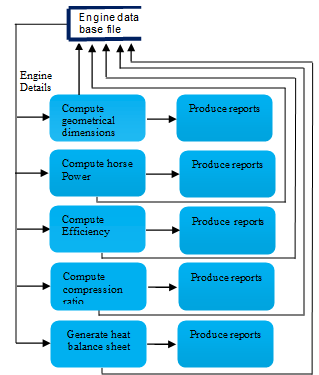
Figure 2 Data flow diagram of Engine information system
Copyrighted material, not to modify and reproduce the material
3.2.4. Compute compression ratio
Details of particular engine flows to process box "Compute compression ratio” compression ratio is computed as processed information is going to store in engine database file and to produce the report to "Produce reports" box See table 7.
3.2.5. Generate heat balance sheet
Details of particular engine flows to process box "Generate heat balance sheet" heat balance sheet is get generated as processed information is going to store in engine database file and to produce the report to "Produce reports” box. See table 1.
3.3. Geometrical dimensions
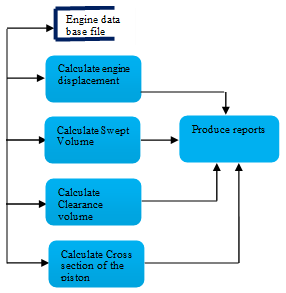
Figure 3 Data flow diagram of geometrical Dimensions
Detail data flow diagram of process box of "Compute geometrical dimensions" of figure 2. From engine database file engine details of particular engine go to process boxes. Process boxes process the information as processed information is going to store in engine database file and to produce the report to "Produce reports” box. Shown in figure 3 and See table 3 & 4.
3.3.1. Engine Displacement
Details of particular engine go to “Calculate engine displacement " process box. Engine displacement is get calculated as processed information is going to store in engine database file and to produce the report to "Produce reports" box. Engine displacement has been defined as the total volume displaced by all the pistons as they move from their top dead center position. It determines the size of an engine in cubic centimeters (cc). This volume depends on the cylinder diameter (bore), piston stroke and the number of cylinder see equation 1.
π = 3.14
D = Diameter of the cylinder, cm (1)
L = Length of the stroke, cm
N = Number of cylinders
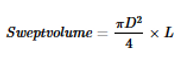
3.3.2. Swept Volume
Details of particular engine go to “Calculate swept volume” process box. Swept volume is get calculated as processed information is going to store in engine database fileandto produce the report to “Produce reports” box. Swept volume is calculated as see equation 2.
π= 3.14 (2)
D = Diameter of the cylinder
L= Length of stroke
3.3. 3 Cylinder Volume
Details of particular engine go to ”Calculate cylinder volume” process box. Cylinder volume is get calculated as processed information is going to store in engine database file and to produce the report to “Produce reports “box. See equation 3.
Cylinder volume=sweptvolume + clearenceevolume
(3)
3.3.4. Clearence Volume
Details of particular engine go to “Calculate clearance volume” process box. Clearance volume is get calculated as processed information is going to store in engine database file and to produce the report to “Produce reports” box. In the cylinder volume above the piston at top dead center is the clearance volume. Clearance volume is calculated as See equation 4.
π= 3.14 (4)
D= Diameter of the cylinder
H= Height from TDC to Cylinder head
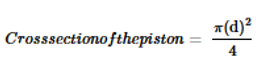
3.3.5 Cross-section of the piston
Details of particular engine go to” Calculate cross section of the piston” process box. Cross section of the piston is get calculated as processed information is going to store in engine database file and to produce the report to “Produce reports” box. See equation 5.
π= 3.14 (5)
D=bore

Copyrighted material, not to modify and reproduce the material
3.4. Horse Power
Detail dataflow diagram of process box of “Compute horse power” of figure 2. From engine database file engine details of particular engine go to process boxes. Process boxes process the information as processed information is going to store in engine database file and to produce the report to "Produce reports" box. See figure 4.
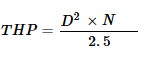
3.4.1.Tax Horse power
Details of particular engine go to “Calculate tax horse power” process box. Tax horse power get calculated as processed information is going to store in engine data base file and to produce the report to “Produce reports” box. The RAC (Royal Automobile Club of England) horse power rating of engines is used to compare engines on the basis of the number and diameter of cylinders. This horse power rating is usually for tax purposes, and hence called taxablehorse Power. RAC horse power is given by. See equation 6.
D = diameter (or bore) of the cylinder (6)
N = number of cylinders
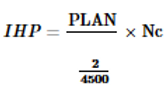
3.4.2.Indicated Horse power
Details of particular engine goto “Calculate indicated horse power" process box. Indicated horse power is get calculatedas processed information is going tostore in engine database file and to producethe report to “Produce reports" box. The power actually developed inside the engine cylinder by the combustion of fuel is called indicated horse power. Indicated horse power will be calculated for N number of cylinders If you enter number of cylinder 1 then it is getting calculated for 1 cylinder if you enter number of cylinders 4 then it will be calculated for 4 cylinders.See equation 7.
P = Mean effective pressure in kg/cm² (7)
L = Length of stroke
A = Area of piston in cm²
N = Number of RPM of crankshaft
Nc = Number of cylinders
3.4.3. Brake Horse Power
Details of particular engine go to “Calculate brake horse power” process box brake horse power is get calculated as processed information is going to store in engine data base file and to produce the report to “Produce reports “box. The power which the engine actually delivers to do the outside work is called brake horse power. It is the output power of an engine. It is usually 70 to 85% of its indicated horse power. It can be measured by some measuring instruments like prony brake or dynamometer and is given by the following relation. See equation 8.
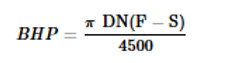
π= 3.14
D= Diameter of the brake drum
N = Number of RPM of crank shaft (8)
F= Force registered on scale
S=Spring balance reading

Figure 4 Dataflow diagram of engine horse power
3.4.4 Friction horse power
Details of particular engine go to “Calculate Friction horse power” process box. Friction horse power is get calculated as processed information is going to store in engine data base file and to produce the report to “Produce reports” box. Friction horse power output power (or BHP) of an engine is always less than the input power (or IHP), because some power is lost in overcoming the friction between the moving parts. The power lost in friction in engine mechanism is called friction horse power. It is equal to the difference between the IHP and BHP. See equation 9.
FHP = IHP -- BHP (9)
3.5 Efficiency
Detail dataflow diagram of process box of “Compute efficiency” of figure2. From engine database file engine details of particular engine goes to process boxes. Process boxes process the information as processed information is going to store in engine database file and to produce the report to "Produce reports" box. See figure 5.
3.5.1. Mechanical efficiency
Details of particular engine go to “Calculate mechanical efficiency” process box. Mechanical efficiency is get calculated as processed information is going to store in engine data base file and to produce the report to “Produce reports” box
Mechanical efficiency is the ratio of brake horse power to indicated horse power. See equation 10.
(10)
3.5.2. Brake thermal efficiency
Details of particular engine go to “Calculate brake thermal efficiency" process box. Brake thermal efficiency is get calculated as processed information is going to store in engine database file and to produce the report to "Produce reports" box. It is the ratio of BHP or IHP to that heat energy of the fuel supplied during the same interval of time. Efficiency based on BHP is called Brake thermal efficiency. See equation 11.
W =Weight of cooling water supplied in kg/min (11)
Q = Lower calorific value in the fuel in kcal/kg
J = Mechanical equivalent of heat = 427

Copyrighted material, not to modify and reproduce the material
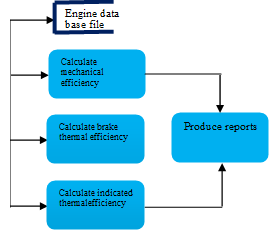
Figure 5 Data flow diagram of engine efficiency
3.5.3. Indicated thermal efficiency
Details of particular engine go to "Calculate indicated thermal efficiency” process box. Indicated thermal efficiency is get calculated as processed information is going to store in engine data base file and to produce the report to "Produce reports" box. It is the ratio of BHP or IHP to that heat energy of the fuel supplied during the same interval of time. Efficiency based on IHP is called Indicated thermal efficiency. See equation 12.
(12)
W =Weight of cooling water supplied in kg/min
Q = Lower calorific value in the fuel in kcal/kg
J = Mechanical equivalent of heat = 427
3.6 Compression ratio
Detail data flow diagram of process box of "Compute compression ratio" of figure2. From engine data base file engine details of particular engine go to process boxes. Process boxes process the information as processed information is going to store in engine database file and to produce the reports to “Produce reports box”.

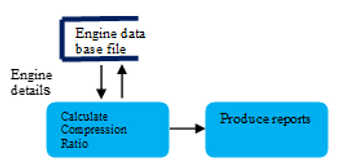
Figure 6 Data flow diagram of Compression ratio
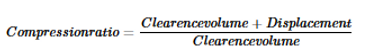
Details of particular engine go to "Calculate compression ratio” process box compression ratio isget calculated as processed information is going to store in engine database file and to produce the report to "Produce reports" box. See figure 6. It is the ratio of the charge in the cylinder above the piston at bottom dead centre and the volume of the charge when the piston is at top dead center. Since the volume above the piston at bottom dead center is the displacement of the cylinder plus the clearance volume and the volume above the piston at top dead center is the clearance volume, the compression ratio can be stated as see equation 13.
(13)
3.7 Heat balance sheet
Detail dataflow diagram of process box of “Generate heat balance sheet” of figure 2. From engine database file engine details of particular engine go to process boxes. Process boxes process the information as processed information is going to store in engine database file and to produce the report to “Produce reports” box.
Copyrighted material, not to modify and reproduce the material
Details of particular engine go to" Generate heat balance sheet" process box. Heat balance sheet is get generated as processed information is going to store in engine data base file and to produce the report to "Produce heat balance sheet " box. See figure 7.
3.7.1 Heat supplied
Heat supplied by the combustion of fuel
The weight of the fuel supplied in kg/min
Calorific value of the fuel in kcal/kg
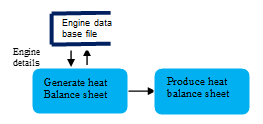
Figure 7 Data Flow diagram of heat balance sheet
3.7.2 Heat to IHP
Heat converted to IHP
3.7.3 Heat to cooling water
Heat carried away by cooling water. See equation 14.
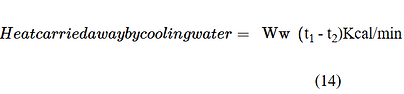
Ww = weight of cooling water supplied in kg/min
t1 = temperature of cooling water at outlet in °C
t2 =temperature of water at inlet in°C
3.7.4 Heat to exhaust gas
Heat carried away by exhaust gases can be determined by the exhaust gas calorimeter. See equation 15.
Heat taken away by the water from the
exhaust gases =
(15)
Q = lower calorific value in the fuel in kcal/kg
Ww = weight of water flowing in kg /min
Tw2 = Temperature of water at outlet in °C
Tw1 = Temperature of water at inlet in °C
Table 1 Heat balance sheet
Reports 4
4.1 Single engine report
Report of each engine pertaining to engine number report will be displayed in one page report includes geometrical dimensions, horse power, efficiency and heat balance sheet.

4.2 Report of engine geometrical dimensions for multiple engines
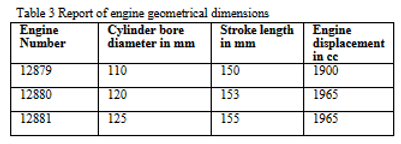
Based on engine number report is going to be displayed for multiple engines in row and column format. Report includes
engine number, cylinder bore diameter, stroke length and engine displacement.
4.2.1Report of engine geometrical dimensions for multiple engines.

Copyrighted material, not to modify and reproduce the material
Based on engine number report is going to be displayed for multiple engines in row and column format. Report includes engine number, swept volume, clearance volume, cylinder volume and cross section of the piston.
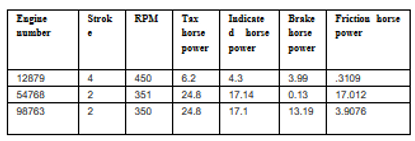
4.2.2. Report of engine horse power for multiple engines
Based on engine number report is going to be displayed for multiple engines in row and column format. Report includes engine number, number of strokes, RPM, tax horsepower,Indicated horse power, brake horse power and friction horse power.
Table 5 Report of engine horsepower for multiple engines
4.2.4 Report of engine compression ratio for multiple engines
Table 7 Report of compression ratio for multiple engines

Based on engine number report is going to be displayed for multiple engines in row and column format. Report includes engine number, swept volume clearance volume, cylinder volume and compression ratio.
Copyrighted material, not to modify and reproduce the material
4.2.3 Report of engine efficiency for multiple engines
Table 6 Report of engine efficiency for multiple engines
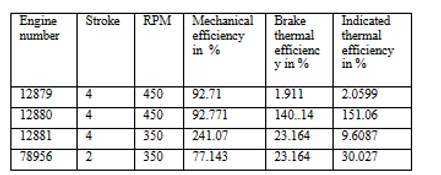
Based on engine number report is going to be displayed for multiple engines in row and column format. Report includes engine number, number of strokes, RPM, mechanical efficiency, breaks thermal efficiency and indicated thermal efficiency.