Welcome to msentert.com's Information technology division
Engine information system
著者 マハマド・スレイマン・ナ�ダフ
Copyrighted material, not to modify and reproduce the material
導入
エンジン情報システム ソフトウェアの構造化システム設計と構造化システム分析。この記事には、EIS の構造図、データ フロー図が含まれています。エンジンの測定とパフォーマンスに関する処理された情報には、シリンダー径、ピストン ストロークの長さ、シリンダー容量などのエンジンの幾何学的寸法である物理的測定と、効率、馬力、圧縮比、熱バランス シートなどのエンジン定格が含まれます。機能指向設計の EIS の構造図では、設計は構造図でグラフィカルに表すことができます。プログラムの構造は、モジュール間の相互接続を収集するために、そのプログラムのモジュールで構成されています。すべてのコンピューター プログラムには構造があり、その構造はプログラムの構造図によって決定できます。プログラムの構造図は、その構造のグラフィカルな表現です。構造図では、モジュールはボックスに書かれたモジュール名で表されます。システムの機能モジュール (問題領域またはソリューション領域のいずれか) は、データ フロー図 (DFD) で表すことができます。データ フロー ベースのモデリングは、多くの場合、問題をモデリングする際に機能ベースの分解を使用する構造化分析手法と呼ばれます。問題領域で実行される機能と、これらの機能によって消費および生成されるデータに焦点を当てます。これはトップダウンの改善アプローチであり、もともと構造化分析仕様と呼ばれ、仕様を作成するために提案されました。システム設計には、構造チャートとデータフロー図で説明されるモジュール設計が含まれます。設計入力、これはデータ入力セクションであり、プログラムのロジックに関係します。入力フィールドに入力する必要があるデータの例は、エンジン番号、シリンダー数、シリンダーボア径などです。これらは入力フィールドです。設計出力、このセクションでは計算結果レポートが提供され、設計出力セクションの一部です。出力は、収集されたソートされた情報レポート、グラフなどの計算結果セットです。EIS は、幾何学的寸法、馬力、効率、圧縮比、熱バランスシートなどのエンジン測定とパフォーマンスのレポートを提供します。
この技術論文は、エンジン情報システム ソフトウェアに関するものです。プログラミング ロジックを使用してソフトウェアを開発する方法と、エンジン パフォーマンスの計算に使用される数式について説明します。EIS の構造化システム設計と構造化システム分析では、ソフトウェア プログラムで使用されるソフトウェア モジュールの構造化システム設計と構造化システム分析について説明します。ソフトウェアは、一連のコンピュータ プログラムです。コンピュータ プログラムは、特定のタスクを実行するようにコンピュータに指示します。EIS は、エンジン パフォーマンスを計算して目的の出力を出すさまざまなプログラムで構成されています。ソフトウェアは、実際のシステムと目的の出力結果の要件に基づいて設計および開発されます。出力は、計算された結果、収集されたソートされた情報、レポート、グラフなどです。EIS は、幾何学的寸法、馬力、効率、圧縮比、熱バランス シートなどのエンジン測定とパフォーマンスのレポートを提供します。情報システム内でデータがどのように移動するかを識別、モデル化、および文書化するプロセスをデータ フローと呼びます。データ フロー モデリングでは、データを 1 つのデータ ストア (データの保持領域)、外部エンティティ (システムにデータを送信するもの、またはシステムからデータを受信するもの)、およびデータ フロー データが流れるルートに変換するプロセス アクティビティを調べます。自動車のパワーユニットは、自動車を駆動する動力を生み出すコンポーネントまたは部品です。これは通常、ガソリンまたはディーゼルで稼働する内燃エンジンの形をとります。実施するテストの性質と種類は、特定の設計の開発度合い、必要な精度、製造会社の性質とその設計戦略に利用できる資金など、さまざまな要因によって異なります。エンジンを稼働させる目的は、機械的な動力を得ることです。エンジンの表示馬力とブレーキ馬力出力の差が摩擦馬力です。ほとんどの場合、良いエンジンと悪いエンジンの違いは、摩擦損失の差によるものです。内燃エンジンの圧縮比は、点火前に燃料混合物が圧縮される度合いです。
2. Structure chart
2.1. Modelling
Structure chart SC in software engineering is a chart which shows the breakdown of system to its lowest manageable levels. They are used in structured programming to arrange programming modules into tree. Each module is represented by a box which contains module name. The tree structure visualizes the relationships between modules. The structure chart is top down modular. Design tool constructed of squares representing the different modules in the system and lines that connect them. In structure analysis structure charts are used to specify the high-level design or architecture of a computer program. Computer program is usually a collection of instructions that can be executed by a computer to perform a specific task. Programmers use a structure chart to build a program in a manner similar to how an architect uses a blueprint to build a house. Represent hierarchical structure of modules. It breaks down the entire system into lowest functional modules to describe functions and sub-functions of each module of a system to a greater detail. Structure Chart partitions the system into black boxes (functionality of the system is known to the users but inner details are unknown). Inputs are given to the black boxes and appropriate outputs are generated. Modules at top level are called modules at low level. Components are read from top to bottom and left to right. When a module calls another, it views the called module as black box, passing required parameters and receiving results. Structure diagrams are all diagrams that model a static component of a system where data changes but not the structures of the elements and their relationships with each other. Data objects are either produced or consumed by the system. During the evaluation and solution synthesis the analyst creates modules of the systems in an effort to understand data and control flow functional processing and operational behavior. These models serve as foundation for software design as the basis of creations of software specifications area of effort is specification. Software requirement specification is document and is producing the functional behavior architectural interface and performance related requirement of the user.
2.2. Engine database file.
Where data is going to be stored after processing the engine’s information. Engine details are identified by unique identification like vehicle or engine make, model or engine number. In this technical paper engine details are identified by engine number.
2.3. Engine
An engine is a module which contains 3 modules see figure 1.
1. Add
2. Update
3. Delete

Figure 1 Structure chart of Engine information system.
2.3.1. Add module
This program module adds the records to database after processing engine’s information. “Add” is having many fields engine number cylinder bore diameter, length of the stroke etc. Data has to be entered in these fields after entering the required data into fields “Add” program computes engine performance send the output to database. Processed records are stored in database file.
2.3.2. Update module
This program module does same as “Add” if you want to make any changes to existing record you can change here based on the engine number primary field or key field. Whenever you want you can fetch the record and can make the changes once the engine number is added that cannot be changed. Based on this field related data can be changed in the update module.
2.3.3. Delete module
This module is used to delete records. Based on engine number fetch the record and delete the entire record including engine number.
2.3.4. Reports
This module produces reports of processed information of engine performance.
1. Single Engine
2. Geometrical dimensions
3. Horsepower
4. Efficiency
5. Compression ratio
6. Heat balance sheet
2.3.5. Single Engine
The report for each engine is going to be displayed on one page.
2.3.6. Geometrical dimensions
A report of geometrical dimensions based on engine number is going to be displayed for multiple engines.
-
Engine displacement
-
Swept volume
-
Cylinder volume
-
Clearance volume
-
Cross section of the piston
Copyrighted material, not to modify and reproduce the material
2.3.7. Horsepower
A report of the horsepower of the engine based on engine numbers is going to be displayed for multiple engines. Tax horsepower
-
Indicated horsepower
-
Brake horsepower
-
Friction horsepower
2.3.8. Efficiency
This module gives a report of efficiency based on engine numbers for multiple engines.
-
Mechanical efficiency
-
Brake thermal efficiency
-
Indicated thermal efficiency
-
Compression ratio
2.3.9. Compression ratio
This module gives the report of compression ratio. See table 7.
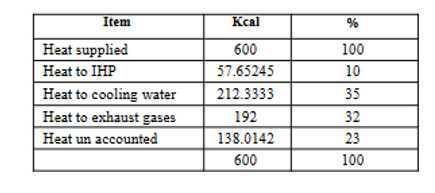
2.3.10. Heat balance Sheet
This module gives information about total heat utilized. The heat produced inside the engine cylinder is not fully utilized to do the external work. Some of the heat is carried away by the engine cooling system, exhaust gases and radiation. These heat losses reduce the thermal efficiency of the engine. Frictional losses are also there which consume about 10% of the total heat produced. About 20% of the heat produced is utilized for turning the wheels. During a specified period (usually a minute), the total heat produced inside the cylinder must be equal to the sum of the various heat losses that are utilized for useful work. All these items, when recorded in a tabular form, constitute what we call a heat balance sheet. See table 1.
3. Data flow diagram
Data flow diagram illustrates how data is processed by a system in terms of inputs and outputs. As it’s name indicates, it focuses on the flow of information where data comes, where data goes, where it stores. They are graphical representation of data flow through a system or sub system used to model information system are used to graphically represent the flow of data in an information system describes the process that is involved in a system to transfer data from the input to the file storage and reports generation
3.1 Software requirement analysis
It is the process of collecting, understanding, modeling and documenting the software requirements which are essential to
develop high quality software. Mostly the software engineer is responsible for the task of software requirement analysis but in case of complex system this task is performed by the specialist commonly referred to as system analyst. It is the job of system analyst to extract exact requirements from the particular area of automotive engineering and specify them in a manner in which these requirements can be translated into design.
3.2. エンジン情報システムのDFD
図 2 を参照してください。エンジン データベース ファイルから、特定のエンジンに関連するエンジンの詳細がプロセス ボックスに移動します。プロセス ボックスは情報を処理し、処理された情報はエンジン データベース ファイルに保存され、レポート ボックスでレポートが生成されます。必要な場合はいつでも、新しいレコードを追加して、データベース ファイルからレコードを取得し、特定のエンジンのレコードを更新または削除できます。
3.2.1. 幾何学的寸法を計算する
特定のエンジンの詳細は、処理ボックス「エンジンの幾何学的寸法を計算」に流れ、幾何学的寸法が計算されます。処理された情報はエンジン データベース ファイルに保存され、「レポートの作成」ボックスにレポートが作成されます。表 3 および 4 を参照してください。
3.2.2. 馬力を計算する
特定のエンジン フローの詳細は、処理ボックス「馬力の計算」に流れます。エンジン馬力は、処理された情報として計算され、エンジン データベース ファイルに保存され、「レポートの作成」ボックスにレポートが作成されます。表 5 を参照してください。
3.2.3. 計算効率
特定のエンジン フローの詳細は、「エンジン効率の計算」ボックスで処理されます。処理された情報はエンジン データベース ファイルに保存され、「レポートの作成」ボックスにレポートが生成されるため、効率が計算されます。表 6 を参照してください。
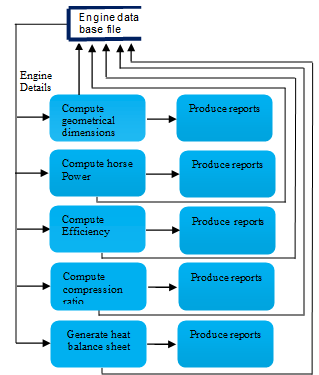
Figure 2 Data flow diagram of Engine information system
Copyrighted material, not to modify and reproduce the material
3.2.4. 圧縮率を計算する
特定のエンジン フローの詳細は、「圧縮率の計算」ボックスを処理します。処理された情報はエンジン データベース ファイルに保存され、「レポートの作成」ボックスにレポートが生成されるため、圧縮率が計算されます。表 7 を参照してください。
3.2.5. 熱バランスシートを生成する
特定のエンジン フローの詳細は、処理ボックス「熱バランス シートの生成」に流れます。処理された情報はエンジン データベース ファイルに保存され、「レポートの生成」ボックスにレポートが生成されるため、熱バランス シートが生成されます。表 1 を参照してください。
3.3. 幾何学的寸法
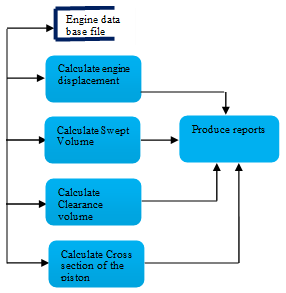
Figure 3 Data flow diagram of geometrical Dimensions
図 2 の「幾何学的寸法の計算」のプロセス ボックスの詳細なデータ フロー図。エンジン データベース ファイルから、特定のエンジンの詳細がプロセス ボックスに移動します。プロセス ボックスは、処理された情報がエンジン データベース ファイルに保存され、「レポートの作成」ボックスにレポートが生成されるように情報を処理しします。図 3 に示され、表 3 と 4 を参照してください。
3.3.1. エンジン排気量
特定のエンジンの詳細は、「エンジン排気量の計算」プロセス ボックスに進みます。エンジン排気量は、処理された情報がエンジン データベース ファイルに保存され、「レポートの作成」ボックスにレポートが生成されるため、計算されます。エンジン排気量は、すべてのピストンが上死点から移動する際に、ピストンによって押しのけられる合計容積として定義されています。エンジンのサイズは、立方センチメートル (cc) で決定されます。この容積は、シリンダー直径 (ボア)、ピストン ストローク、およびシリンダー数によって異なります (式 1 を参照)。
π = 3.14
D = シリンダーの直径、cm (1)
L = ストロークの長さ、cm
N = シリンダー数
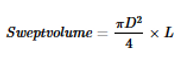
3.3.2. Swept Volume
Details of particular engine go to “Calculate swept volume” process box. Swept volume is get calculated as processed information is going to store in engine database fileandto produce the report to “Produce reports” box. Swept volume is calculated as see equation 2.
π= 3.14 (2)
D = Diameter of the cylinder
L= Length of stroke
3.3. 3 Cylinder Volume
Details of particular engine go to ”Calculate cylinder volume” process box. Cylinder volume is get calculated as processed information is going to store in engine database file and to produce the report to “Produce reports “box. See equation 3.
Cylinder volume=sweptvolume + clearenceevolume
(3)
3.3.4. Clearence Volume
Details of particular engine go to “Calculate clearance volume” process box. Clearance volume is get calculated as processed information is going to store in engine database file and to produce the report to “Produce reports” box. In the cylinder volume above the piston at top dead center is the clearance volume. Clearance volume is calculated as See equation 4.
π= 3.14 (4)
D= Diameter of the cylinder
H= Height from TDC to Cylinder head
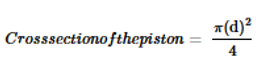
3.3.5 Cross-section of the piston
Details of particular engine go to” Calculate cross section of the piston” process box. Cross section of the piston is get calculated as processed information is going to store in engine database file and to produce the report to “Produce reports” box. See equation 5.
π= 3.14 (5)
D=bore

Copyrighted material, not to modify and reproduce the material
3.4. Horse Power
Detail dataflow diagram of process box of “Compute horse power” of figure 2. From engine database file engine details of particular engine go to process boxes. Process boxes process the information as processed information is going to store in engine database file and to produce the report to "Produce reports" box. See figure 4.
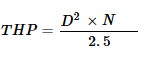
3.4.1.Tax Horse power
Details of particular engine go to “Calculate tax horse power” process box. Tax horse power get calculated as processed information is going to store in engine data base file and to produce the report to “Produce reports” box. The RAC (Royal Automobile Club of England) horse power rating of engines is used to compare engines on the basis of the number and diameter of cylinders. This horse power rating is usually for tax purposes, and hence called taxablehorse Power. RAC horse power is given by. See equation 6.
D = diameter (or bore) of the cylinder (6)
N = number of cylinders
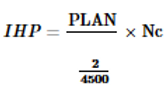
3.4.2.Indicated Horse power
Details of particular engine goto “Calculate indicated horse power" process box. Indicated horse power is get calculatedas processed information is going tostore in engine database file and to producethe report to “Produce reports" box. The power actually developed inside the engine cylinder by the combustion of fuel is called indicated horse power. Indicated horse power will be calculated for N number of cylinders If you enter number of cylinder 1 then it is getting calculated for 1 cylinder if you enter number of cylinders 4 then it will be calculated for 4 cylinders.See equation 7.
P = Mean effective pressure in kg/cm² (7)
L = Length of stroke
A = Area of piston in cm²
N = Number of RPM of crankshaft
Nc = Number of cylinders
3.4.3. Brake Horse Power
Details of particular engine go to “Calculate brake horse power” process box brake horse power is get calculated as processed information is going to store in engine data base file and to produce the report to “Produce reports “box. The power which the engine actually delivers to do the outside work is called brake horse power. It is the output power of an engine. It is usually 70 to 85% of its indicated horse power. It can be measured by some measuring instruments like prony brake or dynamometer and is given by the following relation. See equation 8.
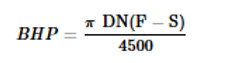
π= 3.14
D=ブレーキドラムの直径
N = クランクシャフトの回転数(8)
F = スケールに記録された力
S=ばね秤の読み取り

Figure 4 Dataflow diagram of engine horsepower
3.4.4 Friction horsepower
Details of particular engine go to “Calculate Friction horse power” process box. Friction horse power is get calculated as processed information is going to store in engine data base file and to produce the report to “Produce reports” box. Friction horse power output power (or BHP) of an engine is always less than the input power (or IHP), because some power is lost in overcoming the friction between the moving parts. The power lost in friction in engine mechanism is called friction horse power. It is equal to the difference between the IHP and BHP. See equation 9.
FHP = IHP -- BHP (9)
3.5 Efficiency
Detail dataflow diagram of process box of “Compute efficiency” of figure2. From engine database file engine details of particular engine goes to process boxes. Process boxes process the information as processed information is going to store in engine database file and to produce the report to "Produce reports" box. See figure 5.
3.5.1. Mechanical efficiency
Details of particular engine go to “Calculate mechanical efficiency” process box. Mechanical efficiency is get calculated as processed information is going to store in engine data base file and to produce the report to “Produce reports” box
Mechanical efficiency is the ratio of brake horse power to indicated horse power. See equation 10.
(10)
3.5.2. Brake thermal efficiency
Details of particular engine go to “Calculate brake thermal efficiency" process box. Brake thermal efficiency is get calculated as processed information is going to store in engine database file and to produce the report to "Produce reports" box. It is the ratio of BHP or IHP to that heat energy of the fuel supplied during the same interval of time. Efficiency based on BHP is called Brake thermal efficiency. See equation 11.
W =Weight of cooling water supplied in kg/min (11)
Q = Lower calorific value in the fuel in kcal/kg
J = Mechanical equivalent of heat = 427

Copyrighted material, not to modify and reproduce the material
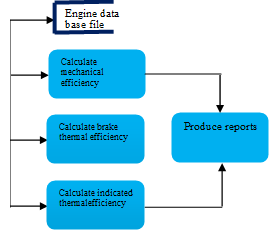
Figure 5 Data flow diagram of engine efficiency
3.5.3. Indicated thermal efficiency
Details of particular engine go to "Calculate indicated thermal efficiency” process box. Indicated thermal efficiency is get calculated as processed information is going to store in engine data base file and to produce the report to "Produce reports" box. It is the ratio of BHP or IHP to that heat energy of the fuel supplied during the same interval of time. Efficiency based on IHP is called Indicated thermal efficiency. See equation 12.
(12)
W =Weight of cooling water supplied in kg/min
Q = Lower calorific value in the fuel in kcal/kg
J = Mechanical equivalent of heat = 427
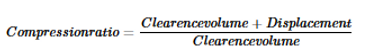
3.6 Compression ratio
Detail data flow diagram of process box of "Compute compression ratio" of figure2. From engine data base file engine details of particular engine go to process boxes. Process boxes process the information as processed information is going to store in engine database file and to produce the reports to “Produce reports box”.

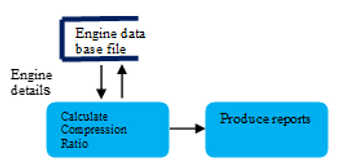
図6 圧縮率のデータフロー図
特定のエンジンの詳細については、「圧縮比の計算」プロセス ボックスに進みます。圧縮比は、処理された情報として計算され、エンジン データベース ファイルに保存され、「レポートの作成」ボックスにレポートが作成されます。図 6 を参照してください。これは、ピストンの下死点上のシリンダー内の充填量と、ピストンが上死点にあるときの充填量の比率です。ピストンの下死点上の容積は、シリンダーの排気量にクリアランス容積を加えたもので、ピストンの上死点上の容積はクリアランス容積であるため、圧縮比は式 13 のように表すことができます。
(13)
3.7 熱バランスシート
図 2 の「熱バランスシートの生成」のプロセス ボックスの詳細なデータフロー図。エンジン データベース ファイルから、特定のエンジンの詳細がプロセス ボックスに移動します。プロセス ボックスは、処理された情報がエンジン データベース ファイルに保存され、「レポートの生成」ボックスにレポートが生成されるため、情報を処理し続けます。
Copyrighted material, not to modify and reproduce the material
特定のエンジンの詳細は、「熱バランスシートの生成」プロセス ボックスに進みます。処理された情報がエンジン データベース ファイルに保存され、「熱バランスシートの生成」ボックスにレポートが生成されるため、熱バランスシートが生成されます。図 7 を参照してください。
3.7.1 供給される熱
燃料の燃焼によって供給される熱
供給される燃料の重量(kg/分)
燃料の発熱量(kcal/kg)
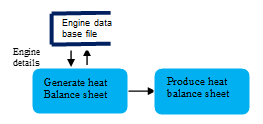
Figure 7 Data Flow diagram of heat balance sheet
3.7.2 Heat to IHP
Heat converted to IHP
3.7.3 Heat to cooling water
Heat carried away by cooling water. See equation 14.
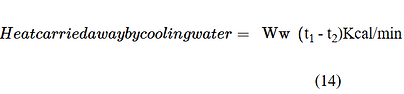
Ww = weight of cooling water supplied in kg/min
t1 = temperature of cooling water at outlet in °C
t2 =temperature of water at inlet in°C
3.7.4 Heat to exhaust gas
Heat carried away by exhaust gases can be determined by the exhaust gas calorimeter. See equation 15.
Heat taken away by the water from the
exhaust gases =
(15)
Q = lower calorific value in the fuel in kcal/kg
Ww = weight of water flowing in kg /min
Tw2 = Temperature of water at outlet in °C
Tw1 = Temperature of water at inlet in °C
Table 1 Heat balance sheet
Reports 4
4.1 Single engine report
Report of each engine pertaining to engine number report will be displayed in one page report includes geometrical dimensions, horse power, efficiency and heat balance sheet.

4.2 複数のエンジンのエンジン形状寸法の報告
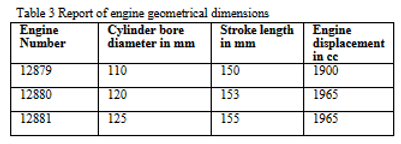
エンジン番号に基づいて、複数のエンジンのレポートが行と列の形式で表示されます。レポートには以下が含まれます。
エンジン番号、シリンダーボア径、ストローク長、エンジン排気量。
4.2.1 複数のエンジンのエンジン形状寸法のレポート。

Copyrighted material, not to modify and reproduce the material
Based on engine number report is going to be displayed for multiple engines in row and column format. Report includes engine number, swept volume, clearance volume, cylinder volume and cross section of the piston.
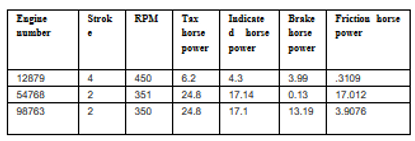
4.2.2. Report of engine horse power for multiple engines
Based on engine number report is going to be displayed for multiple engines in row and column format. Report includes engine number, number of strokes, RPM, tax horsepower,Indicated horse power, brake horse power and friction horse power.
Table 5 Report of engine horsepower for multiple engines
4.2.4 複数のエンジンのエンジン圧縮比のレポート
表7 複数のエンジンの圧縮比の報告

エンジン番号に基づいて、複数のエンジンのレポートが行と列の形式で表示されます。レポートには、エンジン番号、掃引容積、クリアランス容積、シリンダー容積、圧縮比が含まれます。
Copyrighted material, not to modify and reproduce the material
4.2.3 Report of engine efficiency for multiple engines
Table 6 Report of engine efficiency for multiple engines
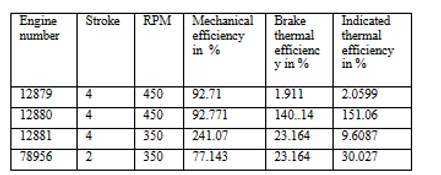
エンジン番号に基づいて、複数のエンジンのレポートが行と列の形式で表示されます。レポートには、エンジン番号、ストローク数、RPM、機械効率、ブレーキ熱効率、および表示熱効率が含まれます。