Welcome to msentert.com's Information technology division
Информационная система двигателя
Автор Махамад Сулеман Надаф
Copyrighted material, not to modify and reproduce the material
Introduction
Structured systems design and structured systems analysis of Engine information system software. This article contains structure chart, data flow diagrams of EIS. Processed information about engine measurement and performance these include physical measurement that is geometrical dimension of engine such as cylinder diameter, length of piston stroke, cylinder volume and engine ratings such as efficiency, horsepower, compression ratio, heat balance sheet. Structure chart of EIS for a function-oriented design the design can be represented graphically by structure charts. The structure of a program is made up of the modules of that program to gather interconnections between modules. Every computer program has a structure it’s structure can be determined by the structure chart of a program is a graphic representation of it’s structure. In a structure chart module is represented by module name written in the box. The functional module of a system (Either the problem domain or the solution domain) can be represented by a Data flow diagram (DFD). Data flow-based modeling is often referred to as the structured analysis technique that uses function-based decomposition while modeling to problem. It focuses on the function performed in the problem domain and the data consumed and produced by these functions. It is a top-down refinement approach which was originally called structured analysis specification and was proposed for producing the specification. System designing includes module designing which are described in structure chart and data flow diagrams. Designing input this is data entry section this is concerned to logic of the program what data has to be entered in the input fields example engine number, no of cylinders, cylinder bore diameter etc. these are input fields. Designing output this section gives the computed results reports are part of the designing output section. The outputs are calculated results set of gathered sorted information reports graphs etc. EIS gives reports of engine measurement and performance such as geometrical dimensions, horsepower, efficiency, compression ratio and heat balance sheet.
2. Structure chart
2.1. Modelling
Structure chart SC in software engineering is a chart which shows the breakdown of system to its lowest manageable levels. They are used in structured programming to arrange programming modules into tree. Each module is represented by a box which contains module name. The tree structure visualizes the relationships between modules. The structure chart is top down modular. Design tool constructed of squares representing the different modules in the system and lines that connect them. In structure analysis structure charts are used to specify the high-level design or architecture of a computer program. Computer program is usually a collection of instructions that can be executed by a computer to perform a specific task. Programmers use a structure chart to build a program in a manner similar to how an architect uses a blueprint to build a house. Represent hierarchical structure of modules. It breaks down the entire system into lowest functional modules to describe functions and sub-functions of each module of a system to a greater detail. Structure Chart partitions the system into black boxes (functionality of the system is known to the users but inner details are unknown). Inputs are given to the black boxes and appropriate outputs are generated. Modules at top level are called modules at low level. Components are read from top to bottom and left to right. When a module calls another, it views the called module as black box, passing required parameters and receiving results. Structure diagrams are all diagrams that model a static component of a system where data changes but not the structures of the elements and their relationships with each other. Data objects are either produced or consumed by the system. During the evaluation and solution synthesis the analyst creates modules of the systems in an effort to understand data and control flow functional processing and operational behavior. These models serve as foundation for software design as the basis of creations of software specifications area of effort is specification. Software requirement specification is document and is producing the functional behavior architectural interface and performance related requirement of the user.
2.2. Engine database file.
Where data is going to be stored after processing the engine’s information. Engine details are identified by unique identification like vehicle or engine make, model or engine number. In this technical paper engine details are identified by engine number.
2.3. Engine
An engine is a module which contains 3 modules see figure 1.
1. Add
2. Update
3. Delete

Figure 1 Structure chart of Engine information system.
2.3.1. Add module
This program module adds the records to database after processing engine’s information. “Add” is having many fields engine number cylinder bore diameter, length of the stroke etc. Data has to be entered in these fields after entering the required data into fields “Add” program computes engine performance send the output to database. Processed records are stored in database file.
2.3.2. Update module
This program module does same as “Add” if you want to make any changes to existing record you can change here based on the engine number primary field or key field. Whenever you want you can fetch the record and can make the changes once the engine number is added that cannot be changed. Based on this field related data can be changed in the update module.
2.3.3. Delete module
This module is used to delete records. Based on engine number fetch the record and delete the entire record including engine number.
2.3.4. Reports
This module produces reports of processed information of engine performance.
1. Single Engine
2. Geometrical dimensions
3. Horsepower
4. Efficiency
5. Compression ratio
6. Heat balance sheet
2.3.5. Single Engine
The report for each engine is going to be displayed on one page.
2.3.6. Geometrical dimensions
A report of geometrical dimensions based on engine number is going to be displayed for multiple engines.
-
Engine displacement
-
Swept volume
-
Cylinder volume
-
Clearance volume
-
Cross section of the piston
Copyrighted material, not to modify and reproduce the material
2.3.7. Horsepower
A report of the horsepower of the engine based on engine numbers is going to be displayed for multiple engines. Tax horsepower
-
Indicated horsepower
-
Brake horsepower
-
Friction horsepower
2.3.8. Efficiency
This module gives a report of efficiency based on engine numbers for multiple engines.
-
Mechanical efficiency
-
Brake thermal efficiency
-
Indicated thermal efficiency
-
Compression ratio
2.3.9. Compression ratio
This module gives the report of compression ratio. See table 7.
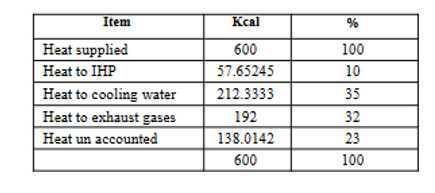
2.3.10. Heat balance Sheet
This module gives information about total heat utilized. The heat produced inside the engine cylinder is not fully utilized to do the external work. Some of the heat is carried away by the engine cooling system, exhaust gases and radiation. These heat losses reduce the thermal efficiency of the engine. Frictional losses are also there which consume about 10% of the total heat produced. About 20% of the heat produced is utilized for turning the wheels. During a specified period (usually a minute), the total heat produced inside the cylinder must be equal to the sum of the various heat losses that are utilized for useful work. All these items, when recorded in a tabular form, constitute what we call a heat balance sheet. See table 1.
3. Data flow diagram
Data flow diagram illustrates how data is processed by a system in terms of inputs and outputs. As it’s name indicates, it focuses on the flow of information where data comes, where data goes, where it stores. They are graphical representation of data flow through a system or sub system used to model information system are used to graphically represent the flow of data in an information system describes the process that is involved in a system to transfer data from the input to the file storage and reports generation
3.1 Software requirement analysis
It is the process of collecting, understanding, modeling and documenting the software requirements which are essential to
develop high quality software. Mostly the software engineer is responsible for the task of software requirement analysis but in case of complex system this task is performed by the specialist commonly referred to as system analyst. It is the job of system analyst to extract exact requirements from the particular area of automotive engineering and specify them in a manner in which these requirements can be translated into design.
3.2. DFD of Engine information system
Refer figure 2 from engine database file engine details which are pertaining to particular engine go to process boxes. Process boxes process the information processed information is going to store in engine database file and to report boxes to produce the reports. Whenever required add new record fetch the record from database file can make update or delete the record of particular engine.
3.2.1. Compute geometrical dimensions
Details of particular engine flows to process box “Compute engine geometrical dimensions” geometrical dimensions are got computed. Processed information is going to store in engine database file and to produce the report to “Produce reports” box. See table 3 and 4.
3.2.2. Compute horsepower
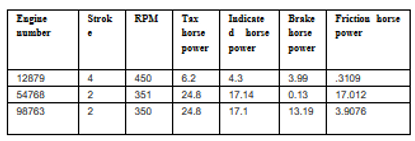
Details of particular engine flows to process box "Compute horsepower" engine horsepower is get computed as processed information is going to store in engine database file and to produce the report to “Produce reports” box. See table 5.
3.2.3. Compute efficiency
Details of particular engine flows to process box "Compute engine efficiency “efficiency is get computed as processed information is going to store in engine database file and to produce the report to “Produce reports” box. See table 6.
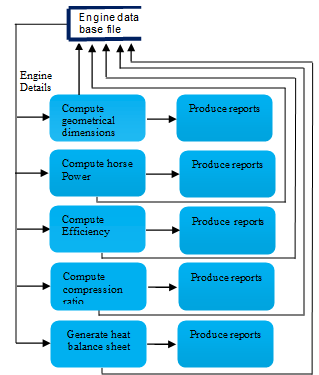
Рисунок 2. Схема потока данных информационной системы Engine.
Copyrighted material, not to modify and reproduce the material
3.2.4. Вычислить степень сжатия
Подробная информация о конкретных потоках механизма в поле обработки «Вычислить степень сжатия». Коэффициент сжатия вычисляется, поскольку обработанная информация будет храниться в файле базы данных механизма и формировать отчет в поле «Создать отчеты». См. таблицу 7.
3.2.5. Составление теплового баланса
Подробная информация о конкретных потоках двигателя в поле обработки «Создание теплового баланса» Тепловой баланс генерируется по мере того, как обработанная информация будет храниться в файле базы данных двигателя и формировать отчет в поле «Создать отчеты». См. таблицу 1.
3.3. Геометрические размеры
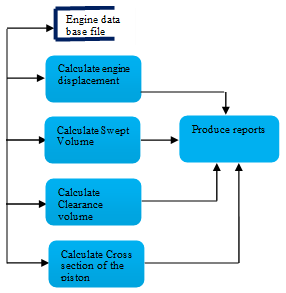
Рисунок 3. Схема потока данных геометрических размеров.
Подробная схема потока данных блока процесса «Вычисление геометрических размеров» на рисунке 2. Из файла базы данных двигателя детали двигателя конкретного двигателя передаются в блоки процесса. Блоки процессов обрабатывают информацию, поскольку обработанная информация будет храниться в файле базы данных механизма и формировать отчет в блоке «Создать отчеты». Показано на рисунке 3, а также см. Таблицы 3 и 4.
3.3.1. Объем двигателя
Подробная информация о конкретном двигателе передается в поле процесса «Рассчитать объем двигателя». Объем двигателя рассчитывается, поскольку обработанная информация будет сохранена в файле базы данных двигателя и создана для отчета в поле «Создать отчеты». Объем двигателя определяется как общий объем, вытесняемый всеми поршнями при движении из верхней мертвой точки. Он определяет размер двигателя в кубических сантиметрах (см3). Этот объем зависит от диаметра цилиндра (отверстия), хода поршня и количества цилиндров (см. уравнение). 1.
π = 3,14
D = Диаметр цилиндра, см (1)
L = Длина хода, см
N = количество цилиндров
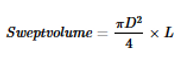
3.3.2. Swept Volume
Details of particular engine go to “Calculate swept volume” process box. Swept volume is get calculated as processed information is going to store in engine database fileandto produce the report to “Produce reports” box. Swept volume is calculated as see equation 2.
π= 3.14 (2)
D = Diameter of the cylinder
L= Length of stroke
3.3. 3 Cylinder Volume
Details of particular engine go to ”Calculate cylinder volume” process box. Cylinder volume is get calculated as processed information is going to store in engine database file and to produce the report to “Produce reports “box. See equation 3.
Cylinder volume=sweptvolume + clearenceevolume
(3)
3.3.4. Clearence Volume
Details of particular engine go to “Calculate clearance volume” process box. Clearance volume is get calculated as processed information is going to store in engine database file and to produce the report to “Produce reports” box. In the cylinder volume above the piston at top dead center is the clearance volume. Clearance volume is calculated as See equation 4.
π= 3.14 (4)
D= Diameter of the cylinder
H= Height from TDC to Cylinder head
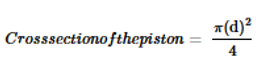
3.3.5 Cross-section of the piston
Details of particular engine go to” Calculate cross section of the piston” process box. Cross section of the piston is get calculated as processed information is going to store in engine database file and to produce the report to “Produce reports” box. See equation 5.
π= 3.14 (5)
D=bore

Copyrighted material, not to modify and reproduce the material
3.4. Horse Power
Detail dataflow diagram of process box of “Compute horse power” of figure 2. From engine database file engine details of particular engine go to process boxes. Process boxes process the information as processed information is going to store in engine database file and to produce the report to "Produce reports" box. See figure 4.
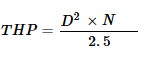
3.4.1.Tax Horse power
Details of particular engine go to “Calculate tax horse power” process box. Tax horse power get calculated as processed information is going to store in engine data base file and to produce the report to “Produce reports” box. The RAC (Royal Automobile Club of England) horse power rating of engines is used to compare engines on the basis of the number and diameter of cylinders. This horse power rating is usually for tax purposes, and hence called taxablehorse Power. RAC horse power is given by. See equation 6.
D = diameter (or bore) of the cylinder (6)
N = number of cylinders
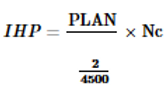
3.4.2.Indicated Horse power
Details of particular engine goto “Calculate indicated horse power" process box. Indicated horse power is get calculatedas processed information is going tostore in engine database file and to producethe report to “Produce reports" box. The power actually developed inside the engine cylinder by the combustion of fuel is called indicated horse power. Indicated horse power will be calculated for N number of cylinders If you enter number of cylinder 1 then it is getting calculated for 1 cylinder if you enter number of cylinders 4 then it will be calculated for 4 cylinders.See equation 7.
P = Mean effective pressure in kg/cm² (7)
L = Length of stroke
A = Area of piston in cm²
N = Number of RPM of crankshaft
Nc = Number of cylinders
3.4.3. Brake Horse Power
Details of particular engine go to “Calculate brake horse power” process box brake horse power is get calculated as processed information is going to store in engine data base file and to produce the report to “Produce reports “box. The power which the engine actually delivers to do the outside work is called brake horse power. It is the output power of an engine. It is usually 70 to 85% of its indicated horse power. It can be measured by some measuring instruments like prony brake or dynamometer and is given by the following relation. See equation 8.
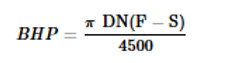
π= 3,14
D= Диаметр тормозного барабана
N = число оборотов коленчатого вала (8)
F = сила, зарегистрированная по шкале
S = показания весеннего баланса

Figure 4 Dataflow diagram of engine horse power
3.4.4 Friction horse power
Details of particular engine go to “Calculate Friction horse power” process box. Friction horse power is get calculated as processed information is going to store in engine data base file and to produce the report to “Produce reports” box. Friction horse power output power (or BHP) of an engine is always less than the input power (or IHP), because some power is lost in overcoming the friction between the moving parts. The power lost in friction in engine mechanism is called friction horse power. It is equal to the difference between the IHP and BHP. See equation 9.
FHP = IHP -- BHP (9)
3.5 Efficiency
Detail dataflow diagram of process box of “Compute efficiency” of figure2. From engine database file engine details of particular engine goes to process boxes. Process boxes process the information as processed information is going to store in engine database file and to produce the report to "Produce reports" box. See figure 5.
3.5.1. Mechanical efficiency
Details of particular engine go to “Calculate mechanical efficiency” process box. Mechanical efficiency is get calculated as processed information is going to store in engine data base file and to produce the report to “Produce reports” box
Mechanical efficiency is the ratio of brake horse power to indicated horse power. See equation 10.
(10)
3.5.2. Brake thermal efficiency
Details of particular engine go to “Calculate brake thermal efficiency" process box. Brake thermal efficiency is get calculated as processed information is going to store in engine database file and to produce the report to "Produce reports" box. It is the ratio of BHP or IHP to that heat energy of the fuel supplied during the same interval of time. Efficiency based on BHP is called Brake thermal efficiency. See equation 11.
W =Weight of cooling water supplied in kg/min (11)
Q = Lower calorific value in the fuel in kcal/kg
J = Mechanical equivalent of heat = 427

Copyrighted material, not to modify and reproduce the material
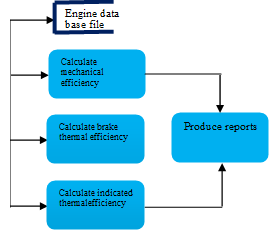
Figure 5 Data flow diagram of engine efficiency
3.5.3. Indicated thermal efficiency
Details of particular engine go to "Calculate indicated thermal efficiency” process box. Indicated thermal efficiency is get calculated as processed information is going to store in engine data base file and to produce the report to "Produce reports" box. It is the ratio of BHP or IHP to that heat energy of the fuel supplied during the same interval of time. Efficiency based on IHP is called Indicated thermal efficiency. See equation 12.
(12)
W =Weight of cooling water supplied in kg/min
Q = Lower calorific value in the fuel in kcal/kg
J = Mechanical equivalent of heat = 427
3.6 Compression ratio
Detail data flow diagram of process box of "Compute compression ratio" of figure2. From engine data base file engine details of particular engine go to process boxes. Process boxes process the information as processed information is going to store in engine database file and to produce the reports to “Produce reports box”.

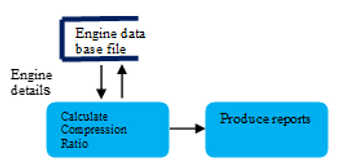
Рисунок 6. Схема потока данных коэффициента сжатия.
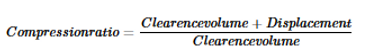
Подробную информацию о конкретном механизме можно найти в окне процесса «Рассчитать степень сжатия». Коэффициент сжатия рассчитывается, поскольку обработанная информация будет сохранена в файле базы данных механизма и для создания отчета в поле «Создать отчеты». См. рисунок 6. Это соотношение заряд в цилиндре над поршнем в нижней мертвой точке и объем заряда, когда поршень находится в верхней мертвой точке, поскольку объем над поршнем в нижней мертвой точке равен рабочему объему цилиндра плюс объем зазора и объем выше. поршень в верхней мертвой точке представляет собой объем зазора, степень сжатия можно определить, как см. уравнение 13.
(13)
3.7 Тепловой баланс
Подробная диаграмма потока данных блока процесса «Создание теплового баланса» на рисунке 2. Из файла базы данных двигателей сведения о двигателе конкретного двигателя передаются в блоки процессов. Блоки процессов обрабатывают информацию, поскольку обработанная информация будет храниться в файле базы данных механизма и создавать отчет в блоке «Создать отчеты».
Copyrighted material, not to modify and reproduce the material
Подробная информация о конкретном двигателе находится в блоке процесса «Создание теплового баланса». Тепловой баланс генерируется по мере того, как обработанная информация будет храниться в файле базы данных двигателя и формировать отчет в поле «Создать тепловой баланс». См. рисунок 7.
3.7.1 Подача тепла
Тепло, выделяемое при сгорании топлива
Вес подаваемого топлива в кг/мин
Теплотворная способность топлива в ккал/кг
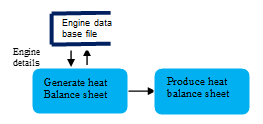
Рисунок 7. Диаграмма потока данных теплового баланса.
3.7.2 Нагрев до ИТП
Тепло, преобразованное в IHP
3.7.3 Преобразование тепла в охлаждающую воду
Тепло уносится охлаждающей водой. См. уравнение 14.
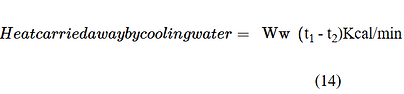
Ww = вес подаваемой охлаждающей воды в кг/мин.
t1 = температура охлаждающей воды на выходе в °C
t2 = температура воды на входе в °C
3.7.4 Тепло для выхлопных газов
Теплоту, уносимую выхлопными газами, можно определить с помощью калориметра выхлопных газов. См. уравнение 15.
Тепло, отнимаемое водой из
выхлопные газы =
(15)
Q = низшая теплота сгорания топлива в ккал/кг.
Ww = вес протекающей воды, кг/мин.
Tw2 = Температура воды на выходе в °C
Tw1 = Температура воды на входе в °C
Таблица 1. Тепловой баланс
Отчеты 4
4.1 Отчет об одном двигателе
Отчет о каждом двигателе, относящийся к номеру двигателя, будет отображаться на одной странице. Отчет включает геометрические размеры, мощность в лошадиных силах, эффективность и тепловой баланс.

4.2 Отчет о геометрических размерах двигателя для нескольких двигателей
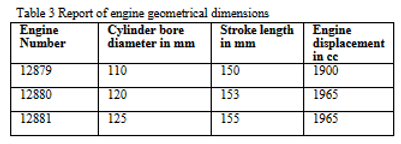
Отчет на основе номера двигателя будет отображаться для нескольких двигателей в формате строки и столбца. Отчет включает в себя
номер двигателя, диаметр цилиндра, длина хода и объем двигателя.
4.2.1 Отчет о геометрических размерах двигателя для нескольких двигателей.

Copyrighted material, not to modify and reproduce the material
Отчет на основе номера двигателя будет отображаться для нескольких двигателей в формате строки и столбца. Отчет включает номер двигателя, рабочий объем, объем зазора, объем цилиндра и поперечное сечение поршня.
4.2.2. Отчет о мощности двигателя для нескольких двигателей
Отчет на основе номера двигателя будет отображаться для нескольких двигателей в формате строки и столбца. Отчет включает номер двигателя, количество ходов, количество оборотов в минуту, налоговую мощность, указанную мощность в лошадиных силах, мощность тормоза и мощность трения.
Таблица 5. Отчет о мощности двигателя для нескольких двигателей
4.2.4 Отчет о степени сжатия двигателя для нескольких двигателей
Таблица 7. Отчет о степени сжатия для нескольких двигателей

Отчет на основе номера двигателя будет отображаться для нескольких двигателей в формате строки и столбца. Отчет включает номер двигателя, рабочий объем, клиренс, объем цилиндров и степень сжатия.
Copyrighted material, not to modify and reproduce the material
4.2.3 Report of engine efficiency for multiple engines
Table 6 Report of engine efficiency for multiple engines
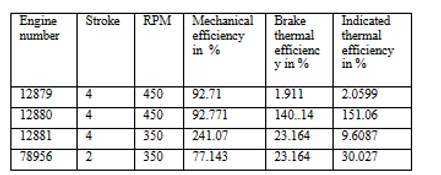
Отчет на основе номера двигателя будет отображаться для нескольких двигателей в формате строки и столбца. Отчет включает номер двигателя, количество тактов, число оборотов в минуту, механический КПД, термический КПД перерывов и индикаторный тепловой КПД.